Last Updated on November 4, 2024
Arduino a Special device we use to make projects & stuff. Arduino IDE have most underrated feature called Serial Plotter. Here we are going to make few experiments to understand its working and its applications. As we know the Arduino IDE’s serial plotter is a tool that allows users to display waveforms or visualize data in real time. When we use Serial Monitor feature, we will see only text and numbers, so that it is little difficult to see the tiny changes in data. But when we use line graph we can easily notice even small changes in data without deep conscious.
What is Serial Plotter?
If you are new to discrete mathematics and graph theory (of course not, you are math genius) – you may ask what is serial plotter? – As we use Grid Graph sheet to plot x, y axis data. The Arduino IDE uses a graphical tool to plot data sent via Serial.print() in real time. Here each line of data received by the serial plotter is treated as a data point on the y-axis with x-axis representing time, some times sequence of data points.
This tool is very useful for monitoring data from sensors, Generating waveform Visualizations or debugging programs that output numerical values.
Setup
To use the Serial Plotter you have to check and follow these basic steps:
- Ensure you have at least version of Arduino IDE 2.3.3 or 1.6.6 later versions which have serial plotter option.
- Connect your Arduino to the computer and open the Arduino IDE.
- Choose right port and board.
- Write and upload a program that sends numerical data over the serial connection.
- Open the Serial Plotter by navigating to Tools > Serial Plotter in the Arduino IDE.
- Set the appropriate baud rate to match the Serial.begin() value in your sketch.
- The Serial Plotter will now display data in real-time as the Arduino sends it.
Components Required
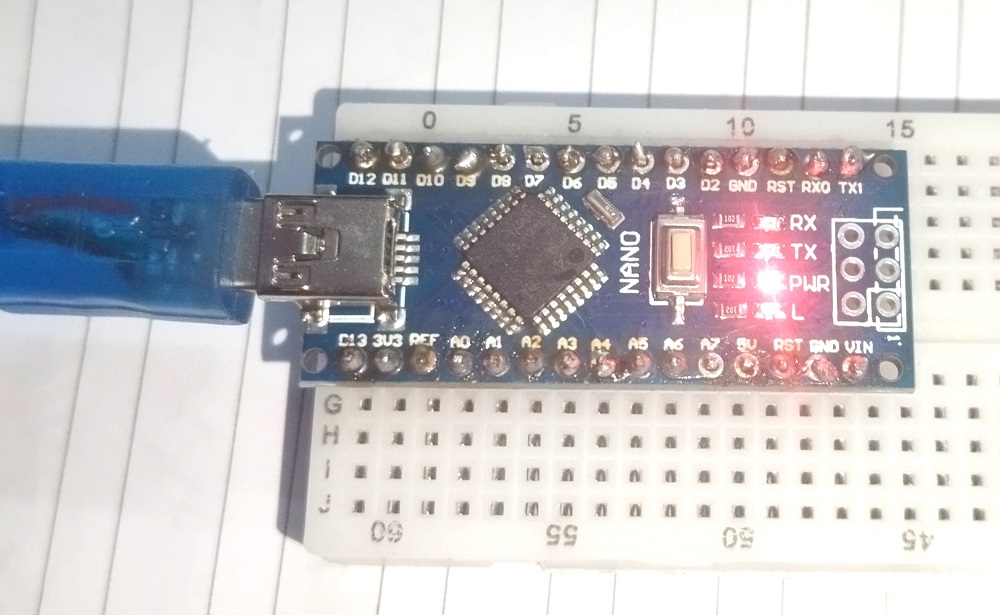
- Arduino Board (we used Arduino Nano)
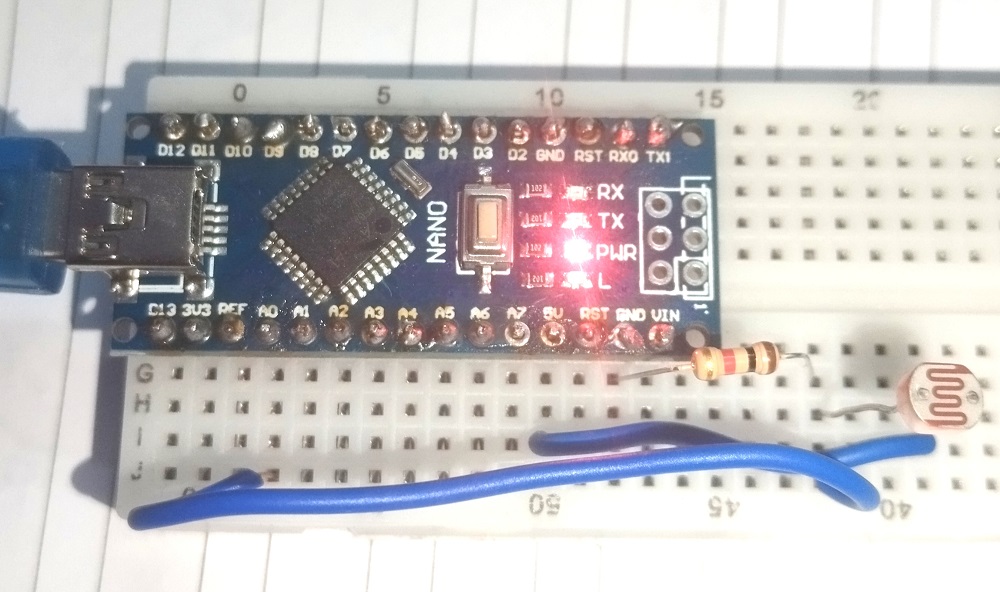
- LDR (as Sensor 1)
- Trimpot 10KΩ (as data source 2)
- Connecting wires and breadboard
Generating and Plotting Waveforms
Working Video
Construction & Working
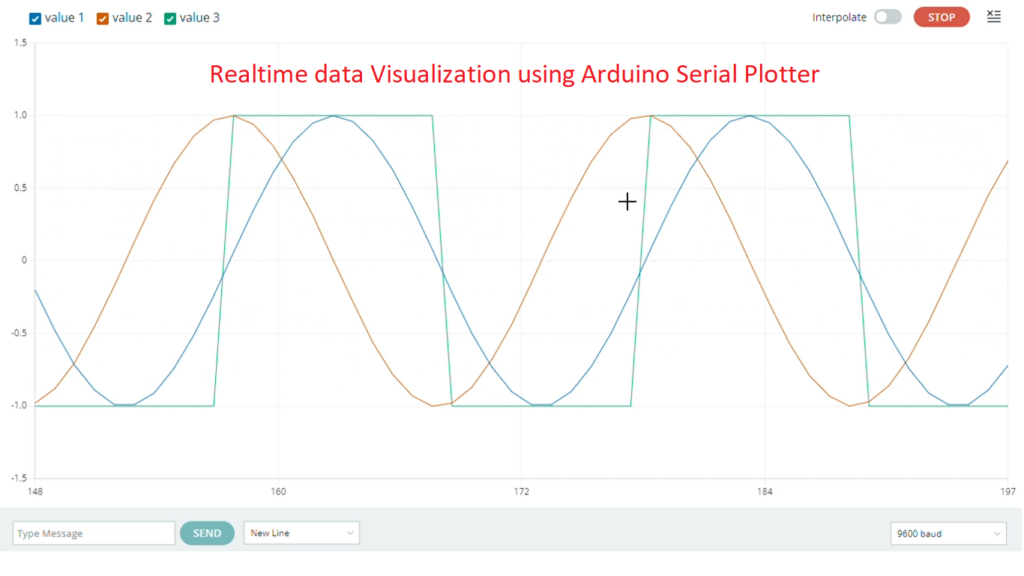
For Generating and Plotting Waveforms just plugin the Arduino board you have and upload the following code then check the serial plotter you will see the visuals.
Code for Generating and Plotting Waveforms
// Sine and Square wave example to demonstrate Serial Plotter usage in Arduino IDE 2.x
float x = 0;

void setup() {
  Serial.begin(9600);  // Initialize serial communication at 9600 baud
}

void loop() {
  float sineWave1 = sin(x);         // First sine wave
  float sineWave2 = sin(x + 1.57);  // Second sine wave (shifted phase)

  // Generate a square wave based on the sine function
  float squareWave = (sineWave1 >= 0) ? 1 : -1;  // Square wave toggles between 1 and -1

  // Output the three values separated by a tab for the Serial Plotter
  Serial.print(sineWave1);
  Serial.print("\t");               // Tab separates the values
  Serial.print(sineWave2);
  Serial.print("\t");               // Tab separates the values
  Serial.println(squareWave);       // Newline ends the line

  x += 0.3;  // Increment x for the next point on sine and square waves
  delay(100); // Delay for readability on the plot
}
Explanation is given along with code. Lets see the applications of serial plotter.
Plotting Sensor Data
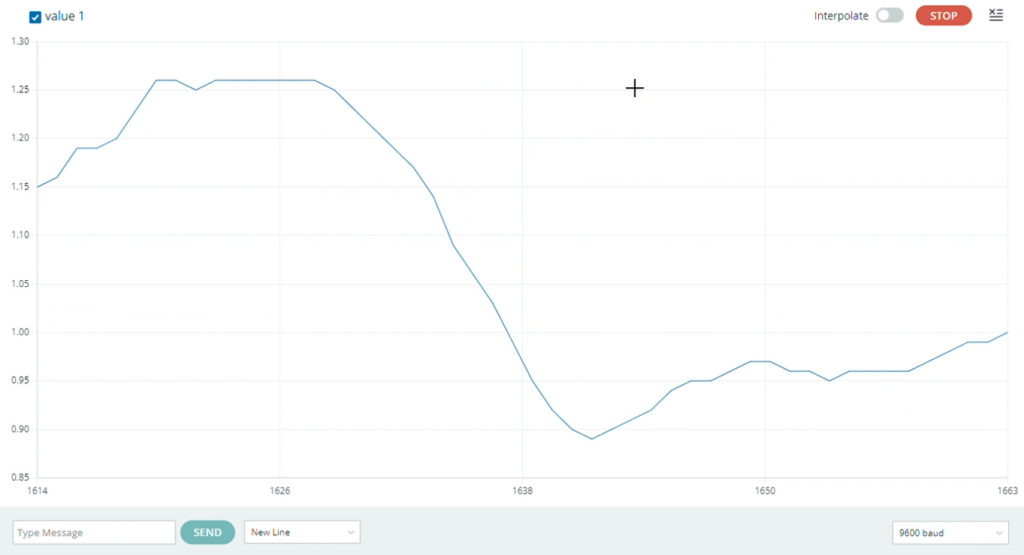
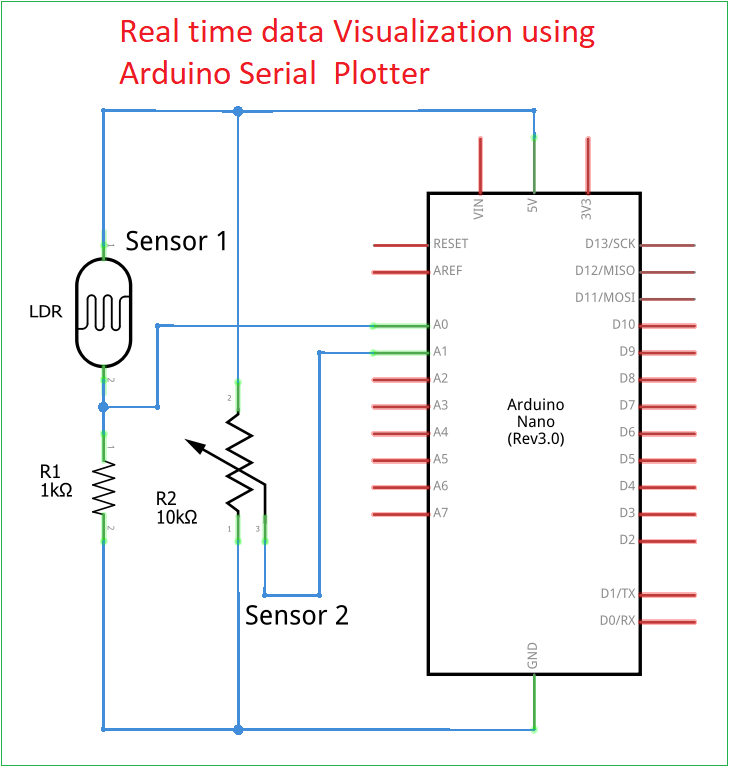
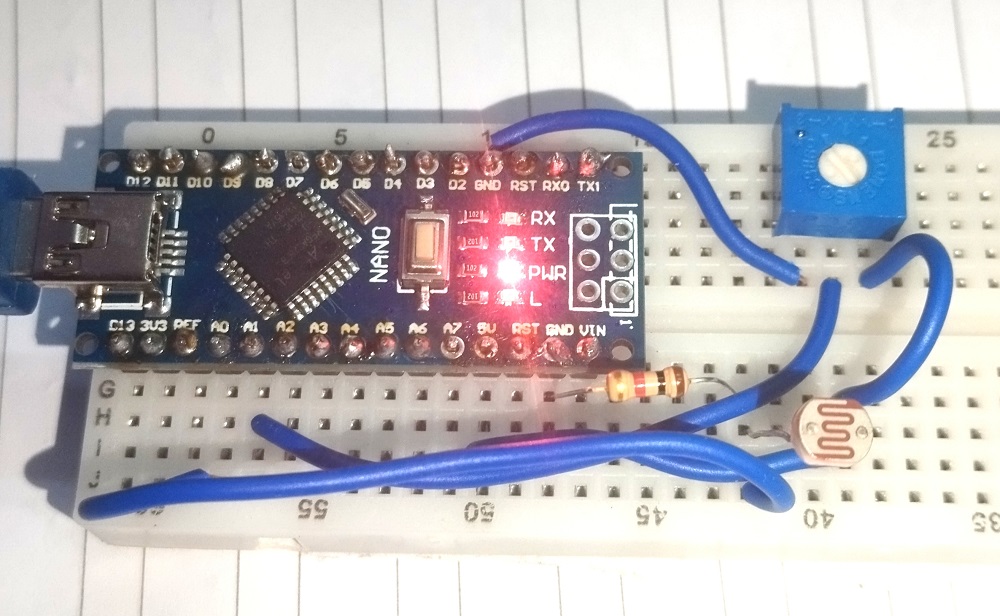
Here we have used a simple photocell (LDR – Light Dependent Resistor) as a sensor to give Analog output. Depends on the intensity of light falls on LDR, it changes Resistance and acts as Voltage divider, so that different level voltage is detected by the Arduino Analog pin, then processed and serially sent to plotter.
Code to Plot Sensor Data
int sensorPin = A0; // Analog pin for sensor input

void setup() {
  Serial.begin(9600); // Initialize serial communication at 9600 baud
}

void loop() {
  int sensorValue = analogRead(sensorPin);  // Read sensor value (0-1023)
  float voltage = (sensorValue / 1023.0) * 5.0;  // Convert to voltage (0.0 - 5.0 V)

  // Send the voltage value to the Serial Plotter
  Serial.println(voltage);

  delay(100);  // Delay for readability
}
Plotting Multiple Sensor Data
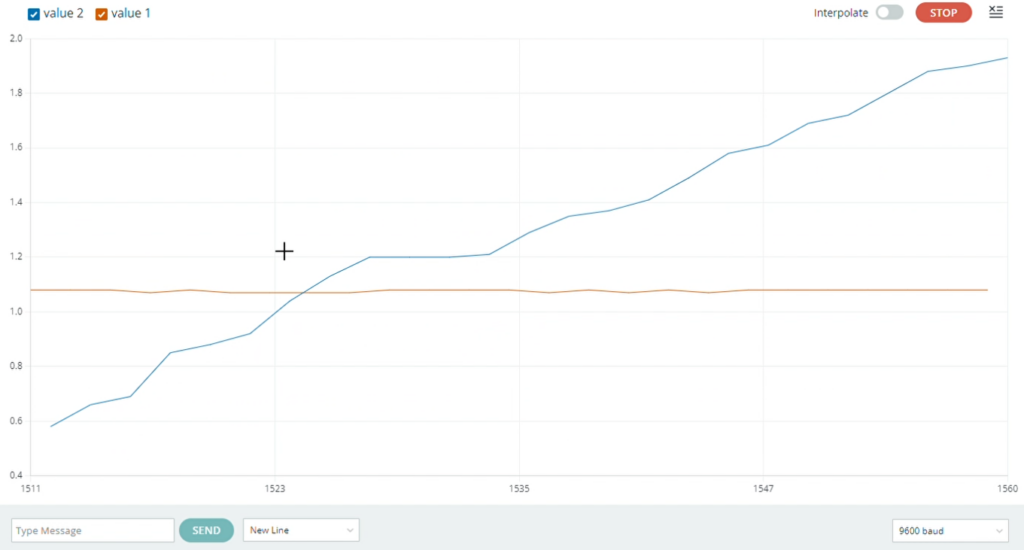
Here we have added additional Data source as second sensor – Trimpot, which will give input to Analog pin A1, so that Arduino can process and plot real time data from multiple sources. It is an example, you can use any type of sensor or data source with Arduino board to get data visuals.
Code to Plot Multiple Sensor Data
int sensorPin = A0; // Analog pin for sensor input
int trimpot = A1; //Analog pin for another input

void setup() {
  Serial.begin(9600); // Initialize serial communication at 9600 baud
}

void loop() {
  int sensorValue = analogRead(sensorPin);  // Read sensor value (0-1023)
  int trimValue = analogRead(trimpot);  // Read sensor value (0-1023)
  float sensvoltage = (sensorValue / 1023.0) * 5.0;  // Convert to voltage (0.0 - 5.0 V)
  float trimvoltage = (trimValue / 1023.0) * 5.0;  // Convert to voltage (0.0 - 5.0 V)

  // Send the voltage value to the Serial Plotter
  Serial.println(sensvoltage);
  Serial.print("\t");
  Serial.println(trimvoltage);

  delay(100);  // Delay for readability
}
Points to Remember for Effective Use of the Serial Plotter
- Separate each data point by a tab (\t) or comma (,), as the Serial Plotter interprets each separated value as a unique variable.
- High baud rates and very short delays can lead to data loss or lag.
- 9600 baud rate and a small delay (100 ms) works well for most sensors.
- For noisy data, consider applying a basic averaging or filtering algorithm in your code to create a cleaner plot.

